Choropleth and Proportional Symbol Mapping in ArcGIS
|
Description: In this exercise, you will become more familiar with the mapping functions of ArcGIS by creating a number of county-level maps with demographic data. This exercise is not graded on its own, but I would like to see one choropleth map and one proportional symbol map you make in this lab on your online portfolio
Method:
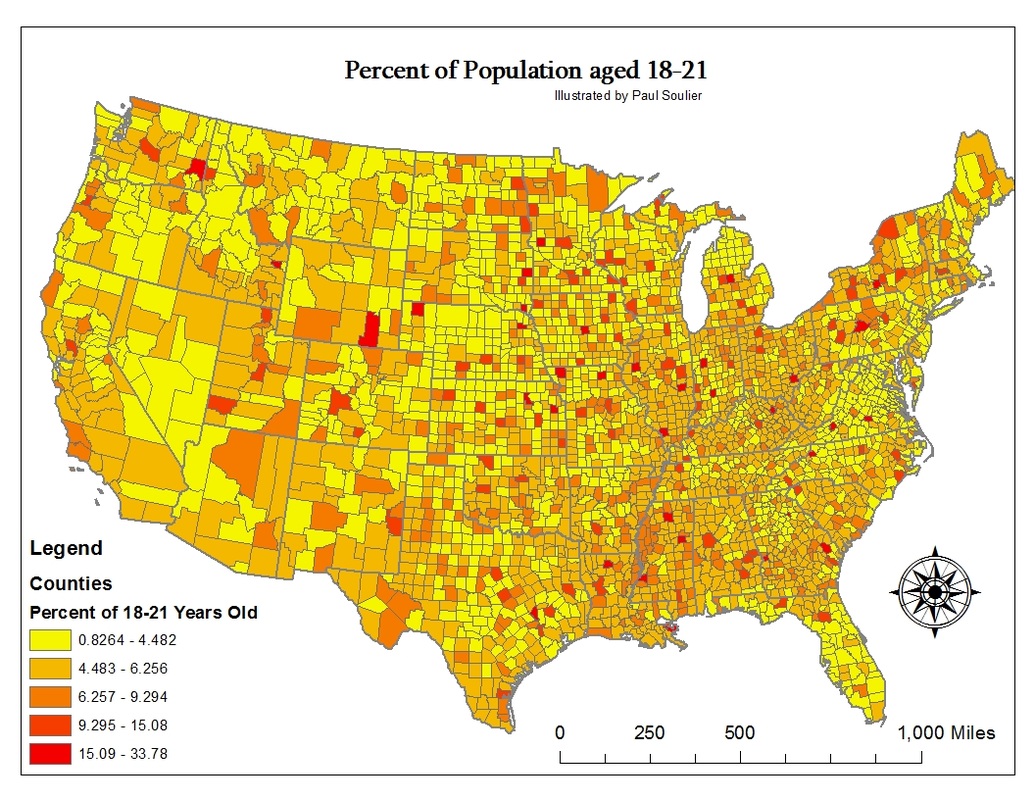
Map 1: A choropleth map of any field in the attribute data. Lower 48 states only. 5 classes. Complete the map in the layout view, add a title, bar scale, north arrow, and a legend.
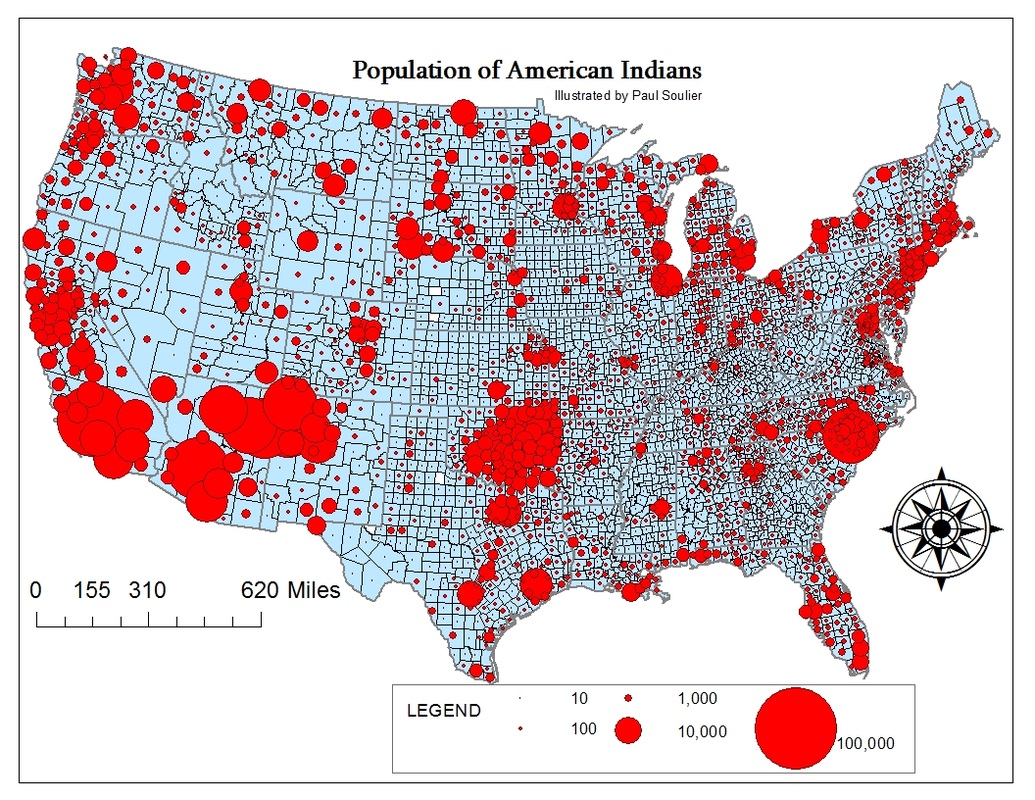
Map 2: A proportional symbol map of any field in the attribute data. Lower 48 states only. Absolute data only. Complete the map in the layout view, add a title, bar scale, north arrow, and a legend.
Difficulties: With the second map, it was difficult finding a topic that I could map that would allow me to use proportional symbols that were not too big or too small. The first map, I had no difficulties with. After learning how to make the map, it was fairly easy.
Method:
Map 1: A choropleth map of any field in the attribute data. Lower 48 states only. 5 classes. Complete the map in the layout view, add a title, bar scale, north arrow, and a legend.
Map 2: A proportional symbol map of any field in the attribute data. Lower 48 states only. Absolute data only. Complete the map in the layout view, add a title, bar scale, north arrow, and a legend.
Difficulties: With the second map, it was difficult finding a topic that I could map that would allow me to use proportional symbols that were not too big or too small. The first map, I had no difficulties with. After learning how to make the map, it was fairly easy.